3-Layer Spherical Lens Focal Plane Mapping
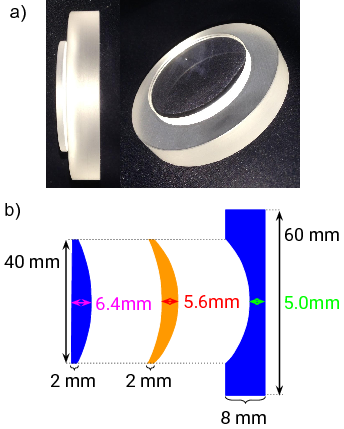
A novel 3-layer spherical lens has been designed for the Detection of Internally Reflected Cherenkov light (DIRC) detector system to be used for the EIC. The lens consists of two layers of fused silica sandwiching a thin layer of lanthanum crown glass NLaK33. The figure below shows two photos of a prototype lens built for testing purposes as well as the dimensions of the lens. Simulation predicts the shape of the focal plane of the new 3-layer lens design for the DIRC@EIC to be relatively flat, providing better focusing at the detector plane of the DIRC detector. A laser setup was built at Old Dominion University (ODU) to measure the focal plane of the prototype lens and verify the shape and position.
Contents
Simulation
The GEANT4 simulation package can be found here [1].
The following is used to run the simulation for the focal plane:
./prtdirc -a 90 -h 1 -s 6 -x "opticalphoton" -p "2.33 eV" -g 0 -c 0 -gsy 0 -gsx 67.5 -e 10000 -b 1 -l 3 -t1 47.8 -t2 29.12 -tr 1 -t3 0 -gx 0 -gz 0
Options: -l = lens code, -t1 = radius of first layer [mm], -t2 = radius of second layer [mm], -tr = separation between beams [mm], -t3 = angle of lens tilt [degrees], -gx = shift of beams away from center in the direction perpendicular to a line connecting the beams [mm], and -gz = shift of beams away from center in the direction along a line connecting the beams [mm].
Setup
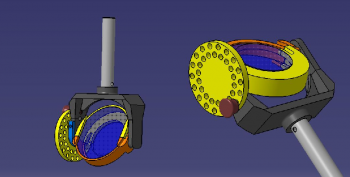
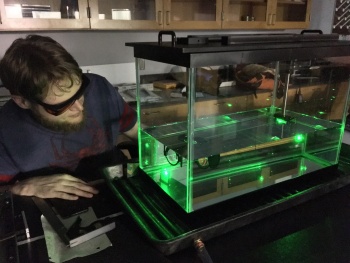
The setup built at ODU (shown below) uses a 530 nm green laser that shines through a 50/50 beam splitter and a mirror to make two parallel beams with a 1 mm separation. The beams pass through a 30x40x60 cm3 glass tank filled with Britol 9NF White Mineral Oil with a refractive index similar to that of fused silica. The beams then pass through the prototype lens, being held in place by a special 3D printed holder which rotates in one plane (called the tilt angle) and is attached to a rotation table on top of the tank that rotates in a perpendicular plane (called θ, or the polar angle). The beams are then focused onto a plastic screen inside the tank that is attached to a sliding track and allowed to move freely. The focal distance is measured from the edge of the lens closest to the screen.
Measurements
Initial measurements were taken with a 632 nm red helium-neon laser, but the beam spot was too large and distorted, so it was replaced by the 530 nm green laser. Beams initially had a separation of 5 mm but were reduced to 1 mm in an effort to reduce effects from aberrations. In order to map the full focal plane for a fixed tilt angle the lens was rotated through a polar angle of between 0° and 50° in 2° increments. Measurements were recorded at each step.
To compensate for the finite size of the beams and the poor resolution of the human eye, a method of averaging was used (illustrated in the figure below) in order to record a more accurate and consistent focal distance. Measurements were taken at the point where the beams seem to first converge and again where they first seem to diverge. The average position of these two points was recorded as the proper focal distance, and lead to a much more consistent measurement and better results.
Initial Results
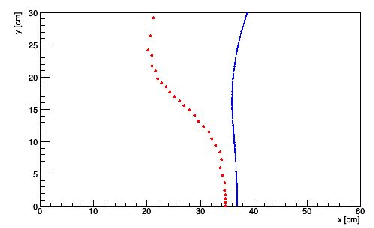
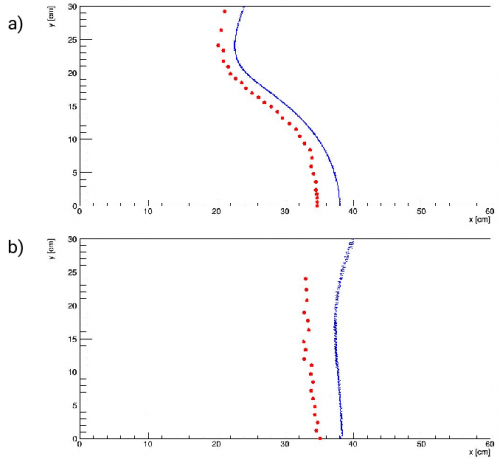
Initially the lens holder was designed such that center of the lens was fixed when rotating through the polar angle. The results, shown below, were much more curved than expected from simulation. The first thought was to narrow the beams to a 2 mm, and finally 1 mm separation, but results were similar.
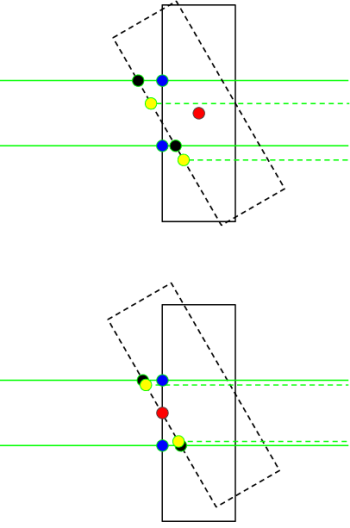
It was then deduced that in the simulation the beams always pass through the same point on the lens surface while, due to the rotation of the holder, they were passing through different points in the ODU setup (illustrated below). A new lens holder was printed such that the lens rotated about its edge to compensate for this difference.
Another round of measurements showed that the original flat shape of the focal plane was recovered when using the new holder. The shape of the plane measured with the original holder was also compared to a modified version of the simulation that took the movement of the beams into account, and again the shape was very nicely reproduced. There was, however, still a systematic shift in the absolute position of the focal plane of ~4cm, which will be addressed later in this article.
Measurements with Tilted Lens
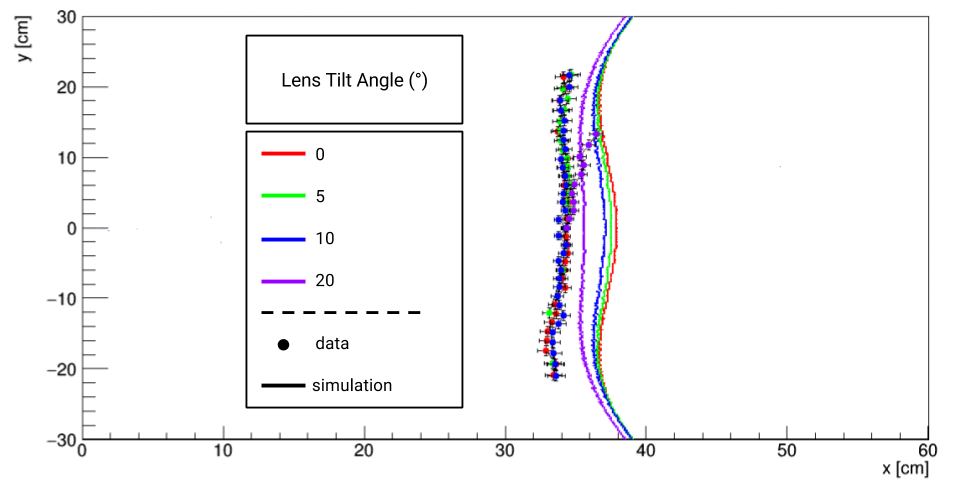
Because the lens holder allows for a secondary plane of rotation (the tilt angle), the full 3D focal plane can be mapped. Below is a plot of the measured and simulated focal plane of 3-layer lens for 0°, 5°, 10°, and 20° tilt angles. For 0° and 10 ° the full plane was mapped for both positive and negative polar angles for sanity checks, while at 5° only a few points for the negative polar angles were selected, and at 20° tilt the beams were already too distorted for a proper measurement so no negative polar angles were measured. Again, the laser data nicely reproduces the simulation's shape, neglecting the 4 cm shift, up to 10° tilt, while going to larger tilts the finite size of the beams lead to too much distortion, making measurements unreliable and inaccurate.
Error Evaluation
To evaluate the error associated with the position of the focal point, 10 measurements were done at both 0° and 10° polar angle rotation one after another to get the standard deviation of the measured positions. This resulted in a 0.29 cm uncertainty.
The uncertainty in the angle of the rotation table was assumed to be 1° as multiple alignments were done to set the lens to a "zero" position which resulted in a maximum deviation of 1°. The actual uncertainty in the rotation angle is likely much smaller.
Understanding the Systematic Shift
Several contributions were considered for explaining the 4 cm systematic shift of the focal plane position: a) a smaller radius of the second curved surface of the lens than was stated in the spec sheet, b) a larger refractive index of the NLaK33 glass layer, c) a smaller index of refraction of the mineral oil than was expected, or d) a small converging angle of the beams off parallel could all explain this shift.
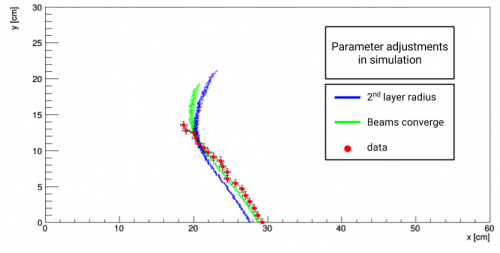
The following plot shows the effect on the focal plane when changing each of these quantities such that the 0° tilt and 0° polar angle point matches that of the laser data (necessary changes shown in table).
| Quantity | Change |
|---|---|
| Radius of second surface | -1.3 mm |
| NLaK33 IoR | +0.03 |
| Oil IoR | -0.15 |
| Beam convergence | 0.15 mrad |
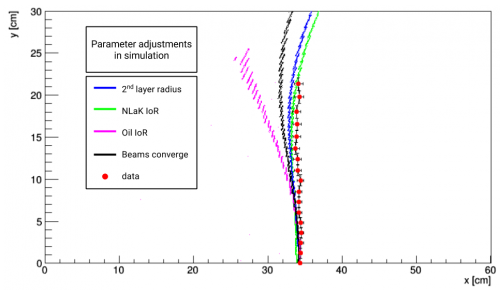
The fact that the shift needed for the oil refractive index gives such a distorted shape rules out this possibility, while the very large deviation from the spec sheet of the refractive index of NLaK33 makes this option highly unlikely. To test the two remaining possibilities, a measurement of the focal plane with the beams off-center of the lens, shifted by 7 mm, was done and compared to simulation for both cases.
As shown in the plot below, the assumption of a converging beam angle agrees very nicely with the data, while the assumption of the smaller radius is too far shifted.
A second shift of the converging angle was checked for both 0° and 10° as well as the 7 mm off-center shift such that instead of the (0°,0°) point from data aligning with simulation, the simulation gave a more averaged description of the data. This was achieved with a 0.1 mrad converging angle. This explanation is the most reasonable in describing the shift of the focal plane position, as the numbers on the spec sheet for the prototype lens are unlikely to be so far off, and such a small angle leads to only a 1 mm change in distance over 10 meters, which is imperceptible with our current setup at ODU.
